Deep learning-based histopathological assessment of renal tissue
Histopathologic assessment of kidney tissue currently relies on manual scoring or traditional image-processing techniques to quantify and classify tissue features. These are time-consuming approaches that have limited reproducibility. Meyke Hermsen et al present an alternative approach, featuring a convolutional neural network (CNN) for multiclass segmentation of periodic acid–Schiff (PAS)-stained kidney tissue sections.
Using multi-class annotations of 40 PAS-stained kidney transplant whole-slide images, the authors trained multiple CNNs through cross-validation. The networks were applied as an ensemble on four independent data sets. Multi-class segmentation performance was assessed by calculcating Dice coefficients (DCs) on an internal test set and a test set from an external center for validation ((the Mayo Clinic, Rochester, Minnesota). Additionally, the authors fully segmented 15 nephrectomy samples and calculated the network's glomerular detection rates and compared network-based measures with visually scored histologic components of the Banff classification system in 82 kidney transplant biopsies.
Their findings demonstrate applicability of CNNs for tissue from multiple centers with weighted mean DCs for all classes of 0.80 and 0.84 on the internal and external test sets, respectively. The best segmented class was "glomeruli" in both data sets (DCs 0.95 and 0.94, respectively), followed by "tubuli combined" and "interstitium." The network detected 92.7% of all glomeruli in nephrectomy samples, with 10.4% false positives. In whole transplant biopsies, the mean intraclass correlation coefficient for glomerular counting performed by pathologists versus the network was 0.94. Finally, the authors found significant correlations between visually scored histologic components and network-based measures.
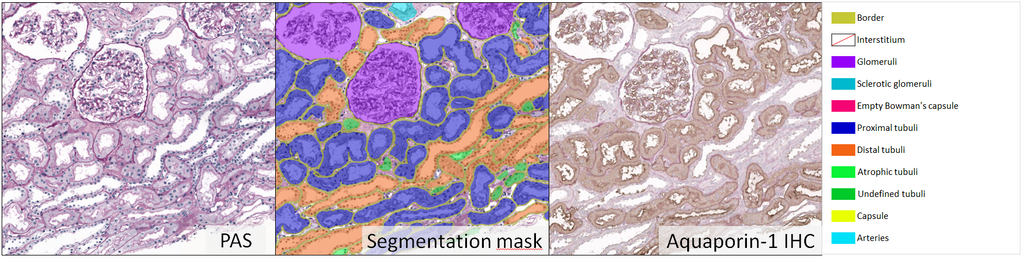
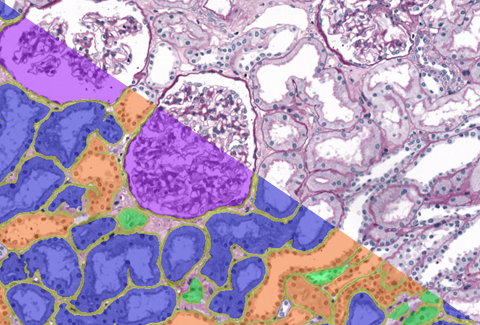
The left picture in the panel above is representative for regions that were used for testing of the CNN (PAS, Radboudumc). The middle picture presents the ouput of the network. For illustrative purposes, the PAS slide was restained using anti- Aquaporin-1 antibody, highlighting proximal tubuli (right). These images illustrate the high accuracy by which the network segments all different structures, the glomeruli and proximal tubuli in particular.
Read more about the author's work in their paper which appeared online yesterday in the Journal of the American Society of Nephrology (JASN).
← Back to overview