Start date: 01-11-2022
End date: 30-04-2023
Clinical Problem
Millions of women undergo breast biopsies (i.e., tissue sampling) each year to determine whether a suspicious lesion found on a mammogram (e.g., calcifications, a mass or density) or on physical examination represents breast cancer (BC). Although 75% of breast biopsies show benign breast disease (BBD), which is reassuring, women with BBD experience a 1.5- to four-fold increased risk of future development of BC compared with women not diagnosed with BBD. To better identify women that would benefit from intensified monitoring, improved prediction of BC risk is urgently needed.
Methods
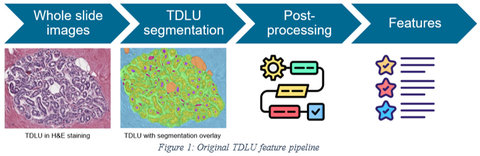
Convolutional neural networks (CNN) to characterize tissue composition of biopsies and assess the morphology of normal breast lobules (which are the source of BBD) have been developed and reported in several publications (PMC9275035; PMC8770616; PMID: 35503494). Terminal duct lobular units (TDLU) are the structures in breast tissue where the precursors of breast cancer arise. One of the CNNs was developed by De Bel et al. and it was used as the basis of this project, an overview of their pipeline can be found in the figure below. Their algorithm segments breast tissue into interlobular stroma, extralobular stroma, lumen, adipose tissue, small vessels, epithelium, and border of the epithelium. A TDLU consists of interlobular stroma, acini (epithelium and lumen), and terminal ducts.
| WSI level | TDLU level |
|---|---|
| Adipose tissue fraction | TDLU size (μm2) |
| Non-adipose tissue fraction | Epithelium-stroma ratio |
| TDLU fraction | Average size acini (μm2) |
| Epithelium fraction | Acini count |
| TDLU count | Epithelium size (μm2) |
| Fat size within TDLU (μm2) | |
| Capillary size (μm2) | |
| Capillary count | |
| Acini large lumen count |
In this project we aimed to identify morphological features in benign breast disease biopsies that have the potential to improve the prediction of the risk estimate for developing BC. We expanded and improved the post-processing of a pre-existing pipeline that is able to segment breast tissue biopsies and extract features based on this segmentation. We expanded the previously developed algorithm by extracting additional features. The new features were extracted with the current segmentation, using HoVer-Net, and a new calcification segmentation network to extract additional features based on cell count and calcifications. The new pipeline can extract a variety of features from whole-slide images (WSI) on a WSI level and a TDLU level. The features from the old pipeline can be found in the table above, the added features are in the table below.
| WSI level | TDLU level |
|---|---|
| Total cell count | Small acini count |
| No label cell count | Average epithelial thickness (μm2) |
| Neoplastic cell count | Total cell count |
| Inflammatory cell count | No label cell count |
| Connective cell count | Neoplastic cell count |
| Necrosis cell count | Inflammatory cell count |
| Non-neoplastic cell count | Connective cell count |
| Epithelial cell count (neoplastic+ non-neoplastic) | Necrosis cell count |
| Calcification count | Non-neoplastic cell count |
| Calcification size (μm2) | Epithelial cell count (neoplastic + non-neoplastic) |
| Calcification count | |
| Calcification size (μm2) |
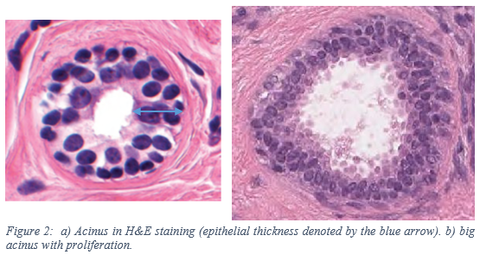
A feature that we added based on the current segmentation is the epithelial thickness, as this can be an indicator for proliferation. A normal acinus only has two layers of epithelial cells. However, in the case of proliferation there are more epithelial cell layers. See the figure below for an example of a normal and a proliferated acinus. With the TDLU segmentation of epithelium and lumen we can determine the thickness of the epithelium. To have a feature on the TDLU level, we calculate the average epithelial thickness across all acini within the TDLU. Per TDLU the total epithelial thickness of all acini is divided by the number of acini.
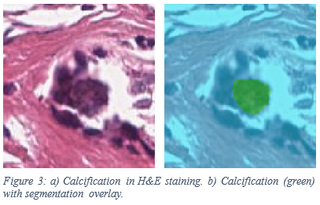
To detect calcifications, we created a new segmentation network with a U-net architecture. The U-net architecture consists out of a contracting part: the encoder, and an expanding part: the decoder. The encoder that is used is the Resnet50 encoder with the weights pre-trained on ImageNet. The calcifications dataset we used contains slides of contiguous tissue slices both in H&E staining and Von Kossa staining. Annotations were made on the H&E WSIs guided by the Von Kossa staining as the calcium deposits show up clearly there. In total, 48 WSIs were annotated with a total of 3730 annotations. The training set contained 24 WSIs; the validation and test set each contained 12 WSIs. The sampling distribution of negative versus calcification annotations was 1:1.5 as there are a lot more negative annotations than calcification annotations
Results
We explored whether features that were extracted have the potential to improve BC risk prediction using a statistical analysis of the results of the final pipeline. First, to describe the relationship of each feature with whether patients developed BC or not, we use the point-biserial correlation. Logistic regression was used to describe the relationship between whether patients developed BC and all the extracted features. On the WSI level, the TDLU count is the only significant feature (p<0.05) with a small negative correlation (-0.068). However, the AUC score is low: 0.47. On the TDLU level the values were aggregated in such a way so that we have the minimum, mean, and maximum per feature for each WSI. This resulted in a total of 72 features. Out of these 72 features only 5 of were significant (p<0.05). These features are: mean of average epithelial thickness, mean of average acini size, maximum of average acini size, minimum of average epithelial thickness, and maximum of the average epithelial thickness. These features, however, do have a low correlation score as well as a low AUC For the TDLU level we again took the minimum, mean, and maximum of the features, thus having 72 features in total This model, without multicollinear variables, has a total of 31 features. In this model, average epithelial thickness mean and epithelial stroma ratio max were significant (p <0.05). Finally, on the TDLU level, both on the individual level as with the logistic regression model we have that the feature average epithelial thickness mean was significant. For the calcification segmentation network, we used a pixel-based calculation to get the accuracy. The final network was able to detect 69% of the calcifications. The f1 score for the calcification class was 0.75.
Conclusion
We investigated the potential of the new features to improve the risk estimate prediction of developing BC. The expansion of the post-processing with HoVer-Net did not give us any significant features. Features that were based on the calcification segmentation were not significant. It is important to note that we should not conclude that calcifications are irrelevant as the network could be improved. The result of this feature for whether it can improve BC risk prediction should be researched further. On the individual level for the WSI level features only the feature TDLU count was significant, however this is a small correlation. All other features were not significant. There were also no significant features in our simple logistic regression model. Based on the individual as well as the simple logistic regression model for the TDLU level features, the feature average epithelial thickness has potential in improving the risk estimate for developing BC. In future research, it would be interesting to integrate the morphological features in pre-existing models, such as the Gail model, to assess whether the prediction of the risk estimate has improved.